Gnowit Tutorial: Generating a Report
Report creation and dissemination is a vital tool in the media monitoring workflow. Whether you are a media analyst, a researcher, a PR specialist or even an executive, the information contained in accurate and relevant media monitoring can dramatically add value to both tactical and strategic decision making. Not only will this information be valuable for you, it can also be relevant and timely for colleagues and clients as well. On the other hand, report creation and dissemination can seem like a waste of time as well as being quite the tortuous process to complete. Just some of the painful experiences that many other companies force upon users are the necessity to collect data from multiple platforms and emails, the required use of XML sheets as well as the general non-intuitiveness nature of most workflows for report sharing.
Creating one report may not be so bad. But what if you have many different clients and stakeholders in different departments that needed you to provide them reports at a daily or weekly basis? It is stressful, and time consuming. Imagine how much time you would save if you could monitor, analyze and export the data in one platform. What would usually take you a few hours a week can be automated by removing the redundancy of building and sharing reports so that you can get back to your other meaningful work.
That is why we at Gnowit have enhanced our reporting mechanism. With Gnowit 2.0, we give you the ability to easily generate professional reports. Let us run through the steps to show you just how easy it is:
Step 1: Enter your report’s title and choose topics (search queries) of interest.
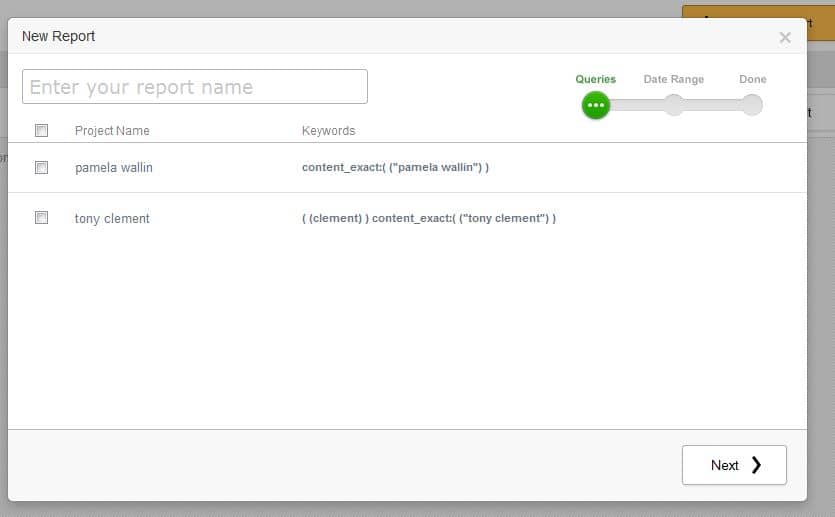
Gnowit’s platform allows you to select multiple projects (queries) of interest. If you would like to share multiple topics to the same group of people, you can pick and choose any topics and insert them into the same PDF file. For this example, I am going to choose both Pamela Wallin and the Honorable Tony Clement.
Step 2: Choose date range
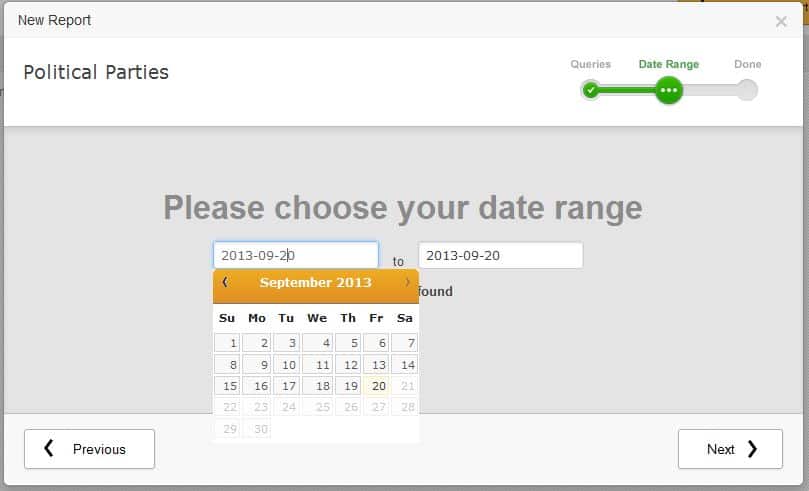
Most communicators send weekly or monthly reports to their respective clients. Choosing a date range allows users to maintain a reporting sequence easily while not having to revisit earlier articles. This feature also makes it easier to skim through and choose articles within the appropriate time range as you can exclude days that you know do not contain relevant results.
Step 3: Choosing articles
Now that you have chosen your search queries and date range, you will get a list of relevant clippings from the news that occurred during that period.
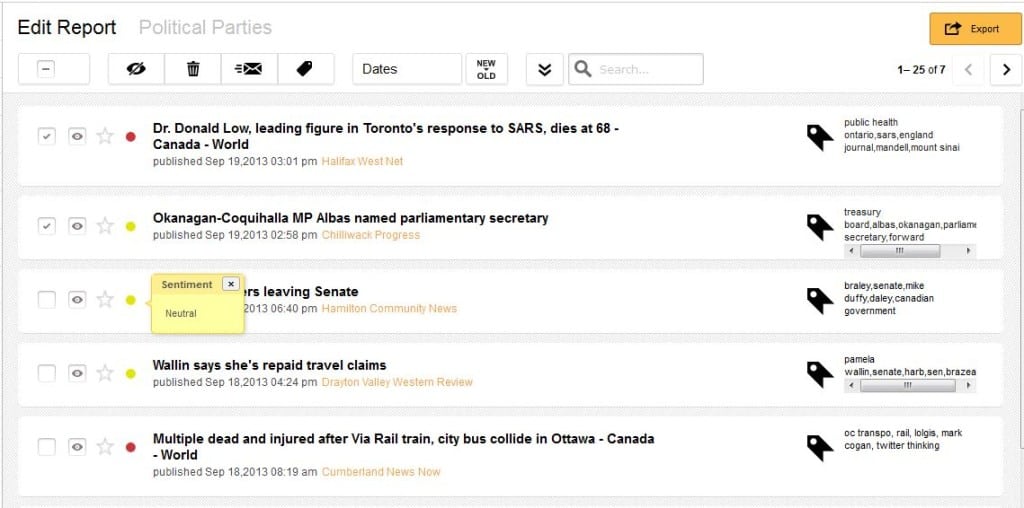
Let’s take one of the “Pamela Wallin” articles and see what we can do with it…
Firstly, I want you to notice the article summary below the title. This summary is automatically extracted using our system. It is meant to give you the sentence that best explains the gist of the article. That way, not only you, but also your clients and colleagues can benefit by rapidly understanding what is and what is not important.
Secondly, you will notice that there are colored dots to the left of every article. These dots are derived from our sentiment engine. Red is negative, green is positive and yellow is neutral. The sentiment identification is one of Gnowit’s core strengths and is currently one of our patent pending features. Nevertheless, what is negative to one person may be positive to another. This is why we give you also give you the power to manually change the sentiment score.
Thirdly, you will notice an empty star to the left of each article mention. This star marks an article as important, if clicked. Starred articles can be listed first in reports as a means to showcase their prominence.
Step 4: Exporting
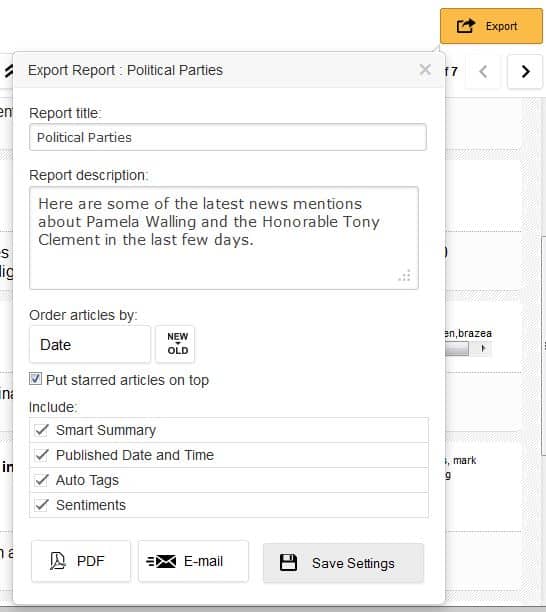
Now that you have chosen you articles, your next step is to export the article. You have the option of exporting it in a PDF format, or sending it via email. The export function also gives you a variety of options for personalization. Let’s take a look:
1. Report title: The title you previously added was for internal use. What you add here will be what the customer sees.
2. Report description: This can be used as an introduction or a summary to your report so that you put everything in context when you share it.
3. Article order: you can arrange your articles that that you can order them by date (newest to oldest or vice versa), source name (alphabetic order for publications), and sentiment (positive to negative or vice versa)
4. Reporting options: You can add sentiment per article, tags, time and date and the article summaries. Once you are happy with the results, publish it.
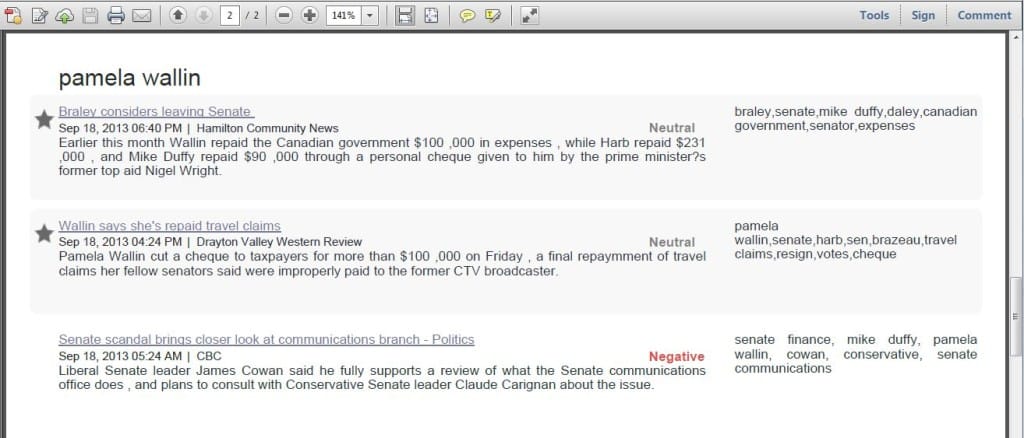
The PDF reports will look like the images you see below:
– Each topic will have its separate page.
– The stared articles will be highlighted and pushed to the top.
– You can include your own logo on the top right of your file.
And there you have it! In a few simple steps, you can create and share professional looking articles. It is white labeled so that you look good when your colleagues and clients see it.
You can refer to our Gnowit 2.0 blog for details of the dashboard.


